
As I’ve been using ShowCrime to begin analysis of Oakland’s historical crime data, I wanted to get an overview of variability across Oakland’s various beats. Boy did I find some!
This PDF file, crimeCatTally_130612_tot, contains a table listing the normalized level of crime in 25 dominant crime categories for each of the 57 police beats defined by OPD. That is, if we first compute for each crime type:
- the beat-average (total number of crimes of this type, divided by 57),
- the standard deviation (S.D., a statistical measure of variation) across the set of per-beat counts for this crime type
the number in the table is the number of standard deviations from the average that each beat experiences. Positive numbers indicate beats with many more crimes than average; negative numbers indicate many fewer. Only those values greater than three S.D. from average are included.
Some numbers seem absolutely crazy. For example, beat 34X shows WEAPONS offenses 23 times the average. But using ShowCrime to plot this example:
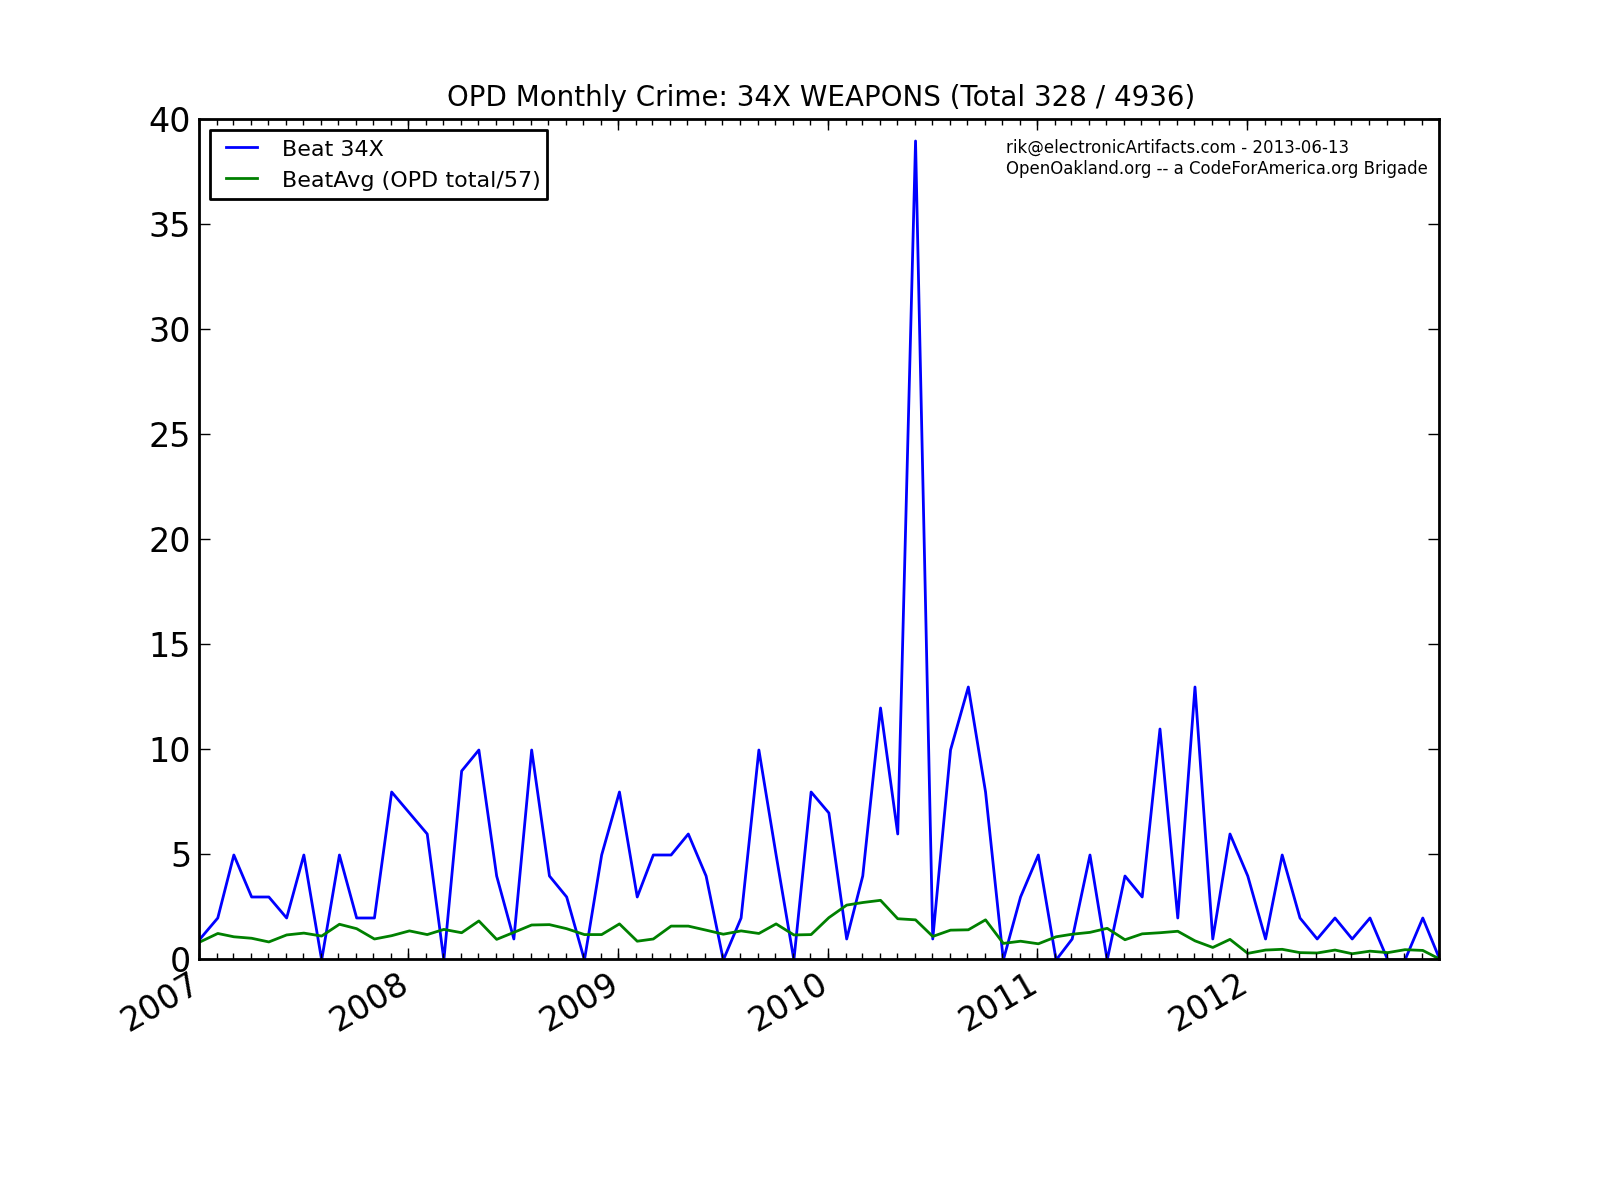
makes it seem right!
Equally obvious is how disparate various beats’ experience of crime is. For example, beat 16X (in the hills between Piedmont and the 580) has much lower crime rates in nearly every category. By contrast, beat 08X (trapped between the crotch of the 580/980 exchange and the NW corner of Lake Merritt) has much higher levels of crime pretty much across the board. Also interesting are beats like 03X, where there are examples of both crime increasing and decreasing, depending which type you have in mind.
Please check out your own beat! (leave a comment here and I’ll give you a password to use). Do these statistics capture your experience of crime in your neighborhood?
Then, think about this question: do the various proposed changes to funding of Oakland’s police department promise to impact the crimes you are experiencing?!
login pw please.
Thank you for doing this.
The very uneven distribution of crime is a major reason elected officials have done little but wring their hands about it for years. Now that crime has moved somewhat into the high voting districts, maybe it will get attention focused on results instead of efforts.
Len