Thanks to the good efforts of staff in the Oakland IT department, a larger set of crime statistics stretching back to at least 2007 was made publicly available. (Update 23 Jan 13: The file seems to have been pulled from ftp://crimewatchdata.oaklandnet.com/ ?
[June, 2013 update: Other posts here at rikiwiki document a process of refining this data, with the current and stable version being at: http://rikiwiki.electronicartifacts.com/wp-content/uploads/2013/06/OPD_combined_130608.csv.zip .]
First pass analysis
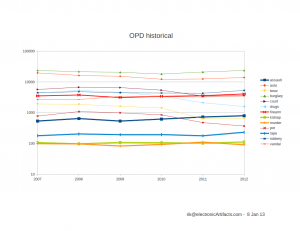
I’ve focussed initial analysis on the subset from 2007 forward, involving crimes occuring > 10 times, and related to a set of especially significant crimes.
A summary of the results is shown below.
 Next steps involve putting up some analysis tools, perhaps like CrimeInChicago site developed in Chicago by OpenCityApps.org . But let me know if you’ve got other analytic ideas!
Comparison to USC data
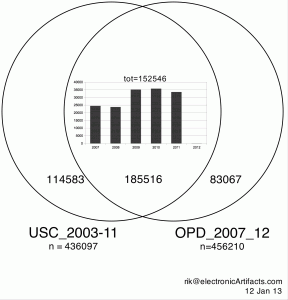
Under a contract with the City of Oakland, the Urban Strategies Council has provided a data set covering the years 2003-2011 that is now available via OpenOakland. Focusing just on the overlapping years of 2007-2011 and using the common shared crime report ID (“RID” field in the USC data, “CASENUMBER” in the OPD data), the Venn diagram below gives a sense of their overlap:
 Howard Jordan’s (Chief of Police, Oakland PD) presentation
Thanks to Chris Bolton for capturing the slides that Chief Jordan presented to the City Council, 13 January 2013. The details of Chief Jordan’s proposal went by me too quickly, even before things went nuts. KPBS agrees: it was a pretty remarkable meeting. (A video archive of the event is also still available if you want to experience the 6+ hours yourself.)
