
Many in Oakland feel as if OPD policing is insufficient, and are willing (and able!) to pay out of their own pockets for private security patrols. Paul Liu has been a leader in his Rockridge neighborhood, first securing CrowdTilt funding for patrols, and then going the extra mile to evaluate how well this intervention is working This post is a second, independent evaluation of this same question.
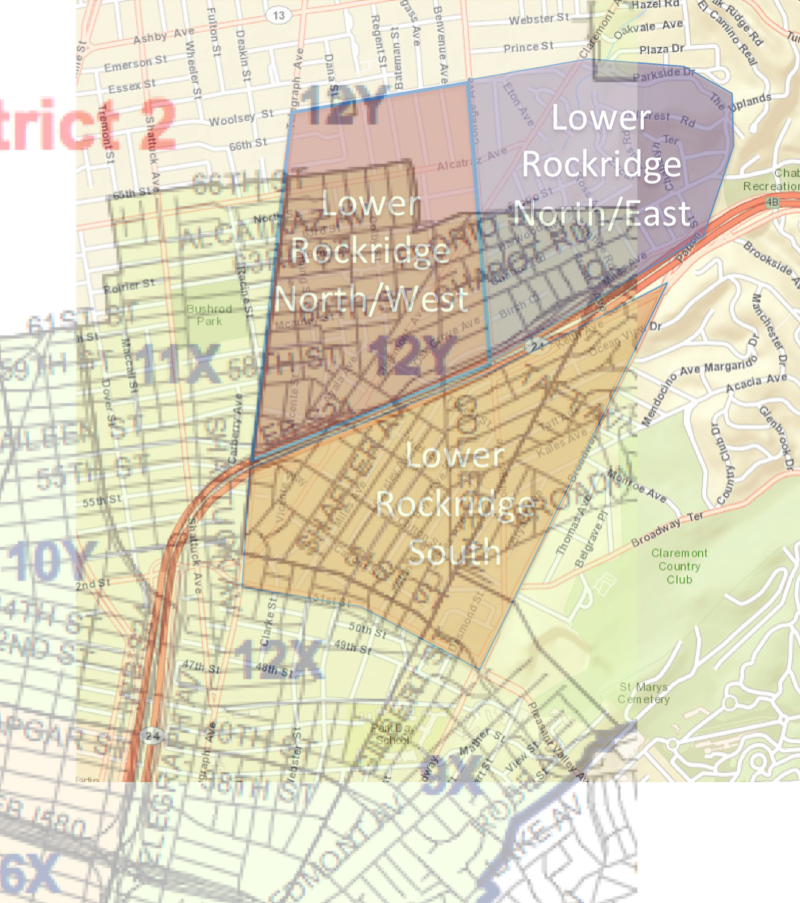
Three Rockridge neighborhoods wound up funding private patrols. Liu attempted to define several circular areas capturing approximately these areas, as well as several adjacent neighborhoods for comparison. Because OPD data does not currently support complete geo-coding (longitude/latitude) for all reported crimes, the approach taken here is to focus on beat-level data: the intervention should impact INTER beats 12X and 12Y, and can be contrasted against OTHER beats 09X (to the south), 11X (west) and 13X (east). The figure below shows the overlaps between these geographic regions.
The private Rockridge patrols began November 4, 2013 and are to continue through at least February, 2014. We will consider the intervention across the four months November’13-February’14 (ie, ignoring that the first few days of Nov’13 were without intervention). Comparison will be made both between 12X+12Y during this period vs. before it, and vs. 09X,11X and 13X during this period.
Liu’s analysis focused exclusively on robberies and burglaries. The full range of reported crimes will be considered here. We can expect that some will be more affected by drive-thru patrols than others.
The Rockridge private patrol (RPP) intervention was localized in both space and time. First, it was localized to an area within the INTER beats, and a spatial comparison can be made with respect to the OTHER beats. Second, the patrols ran for a period of four months, and temporal comparison can be made with respect to the full history of 86 (the years 2007-2013 + Jan,Feb’14 = 7 * 12 + 2) months since 2007.
Note that the intervention period is Nov’13-Feb’14. Suppose someone claimed that the observed difference might have to do with this being “during the holidays.” An alternative hypothesis concerning this temporal pattern is useful for comparison. This could be checked by looking at the subset of months Nov-Feb each year.
A first question is simply whether the RPP changed the volume of total crime in the affected region during the treatment period. Average monthly crime rates with standard deviation bars are shown in the figure below. Here the two INTER beats and the three OTHER beats have been aggregated.
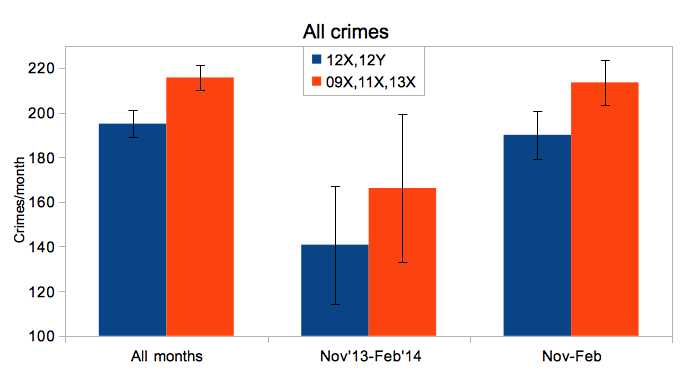
The figure shows that the base frequency of crime was slightly higher in the other beats them in the INTER beats. Considering just the four months of the intervention, crime was much lower in the affected beats than before. The same is true, however of the OTHER beats. Considering the holiday season hypothesis shows a much less pronounced change from the full average.
Next, we can consider just a particular type of crime and how its level has been affected. There are many crime categories that could be considered, and a complete table of all of them is here: statTbl_140403. Here we focus on those that have a significant numbers of occurrences (> 500), appear to have had significant (“periodZ score”) changes during the treatment period, and a difference between affected versus other beat geographic areas. These considerations cause us to focus on LARCENY_BURGLARY_RESIDENTIAL. The number of crimes in this category are listed in the table below
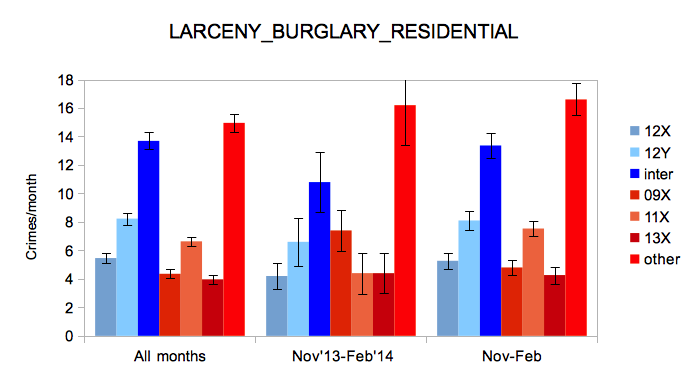
The figure below shows a more detailed view of this crime category, with individual beats broken out together with the INTER and OTHER totals. Even in this particularly changed crime type, measuring the gross INTER versus OTHER aggregate totals, the impact of the intervention during the period does not seem statistically significant.
Rik,
This is Steve Garry. I wrote the comments on “Around the Rose Garden” condemning Paul Liu’s analysis of the “Effectiveness of Private Security Patrols in Lower Rockridge”. At my age it probably shouldn’t bother me but this type of stuff still makes me crazy. I have spent my life analyzing data and somehow it still bothers me when it is not done right.
I’d be happy to talk to you in more detail about the issues Paul’s analysis raises if you are interested. My cell is 510.407.1320 and my other info is below.
Cheers,
slg
Hi Steve, i feel your pain:) i do data science, but on much
simpler time series and types of interventions.
but i don’t find “Around the Rose Garden” , attached or otherwise? where
should I look.
i also sent you a PM via NextDoor, did you get that? i’ll try email.