
Documentation accompanying the “Visualizing Oakland Police Stops – 2015”
Background
A key question facing citizens and police in many cities is how racial profiling may influence discretionary stops. One way to evaluate the distribution of stops, across an entire city and especially as smaller, racially diverse neighborhoods are considered, is to compare the number of stops to the number of times they actually lead to arrests. Jennifer L. Eberhardt and Rebecca C. Hetey have recently completed an analysis of 13 months (April 2013-April 2014) of Oakland Police Department stop data to address questions like this.
Separately, OPD has also provided stop data for 37963 stops occurring during 2015. The visualization described is designed to allow exploration of key features of the data set:
- The geographic distribution of stops across Oakland’s 57 police beats
- The race of those stopped
- A breakdown of vehicle, pedestrian or other (e.g., bicycle) types of stop
- A breakdown of the stop’s result: either leading to arrest (misdemeanor or felony) vs. some other outcome (e.g., citation, incident report)
At present (June 26, 2016) Prof. Eberhardt has chosen not to release any version of the data associated with her study; she does helpfully suggest “… feel free to check back with us in a couple months.” Hopefully, the data presented here can also be used to update Eberhardt and Hetey’s 2013-2014 data when it becomes available.
Details of the visualization interface are presented first, and a summary of basic statistics of this data is provided below.
The interface begins with two radio buttons, specifying first the TYPE of stop (vehicle, pedestrian or other) and second the RESULT of the stop (arrest or non-arrest). The interface begins with a default focus on VEHICLES and NON-ARRESTS; see Figure 1.
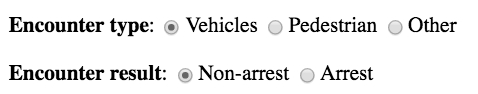
Figure 1
Next are a series of sliders associated with each of the racial groups identified in the stop data. It is initialized to include all races’ data, and so all regions are shown with a deep blue color corresponding to 100%; see the scale shown in Figure 2.
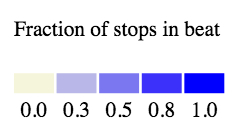
Figure 2
By sliding each of these sliders left or right, the proportion of this demographic group relative to others is increased or decreased. This allows various combinations of racial compositions to be considered. To simplify the examples below, we will focus first on exclusively Hispanic stops, then on Black charges. We do so by first pushing the Hispanic slider all the way to the right, and all others to the left, as shown in Figure 3.

Figure 3
The values displayed are the racially-normalized fractions within each beat. (Two regions are uncolored, corresponding to Lake Merritt and the City of Piedmont.) Using the mouse to hover over Beat 26X for example, a floating caption shows that a total of 630 total vehicle non-arrest stops. 310 of these were of Hispanics, and so the fraction of stops that were of Hispanics in beat 26X is 49.2%, and the beat is colored a medium blue in Figure 4, corresponding to ~50% in the legend.
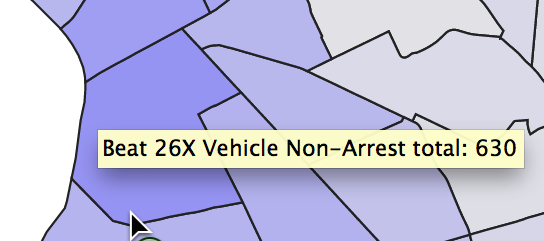
Figure 4
As a second example, changing the sliders to focus on African Americans and considering stops of pedestrians not leading to an arrest within beat 17X, there were a total of 26 stops, 20 of these were of African Americans and the beat is colored a darker blue
corresponding to 77% as shown in Figure 5.
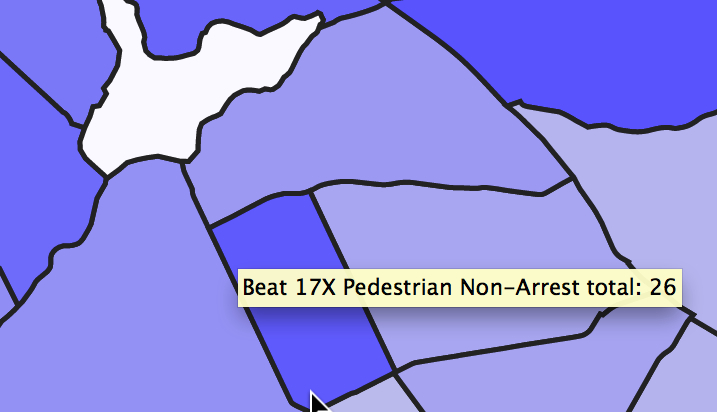
Figure 5
Basic statistics
Figure 6 shows the breakdown of the 2015 stop data by race, type and result of stop. Nearly two-thirds of stops are of African Americans. 83% of all stops were of vehicles. Only 10% of stops result in an arrest.
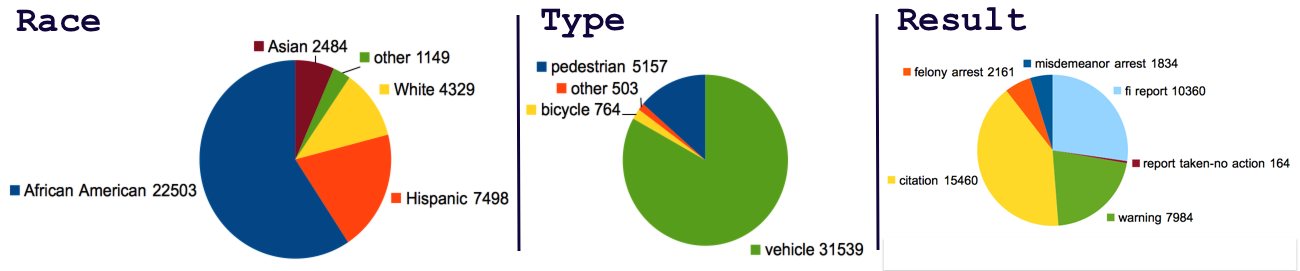
Figure 6
Figure 7a shows the distribution of stops and arrests across all Oakland police beats. A small number of beats (19X, 34X, 23X, 30X, etc.) account for the vast majority of all stops and arrests. Figure 7b zooms in to show that most beats have fewer than 500 stops in 2015, generally leading to 30 or less arrests. Despite the skewed distribution, the number of arrests is in general well-correlated with the number of stops (R2=0.79).
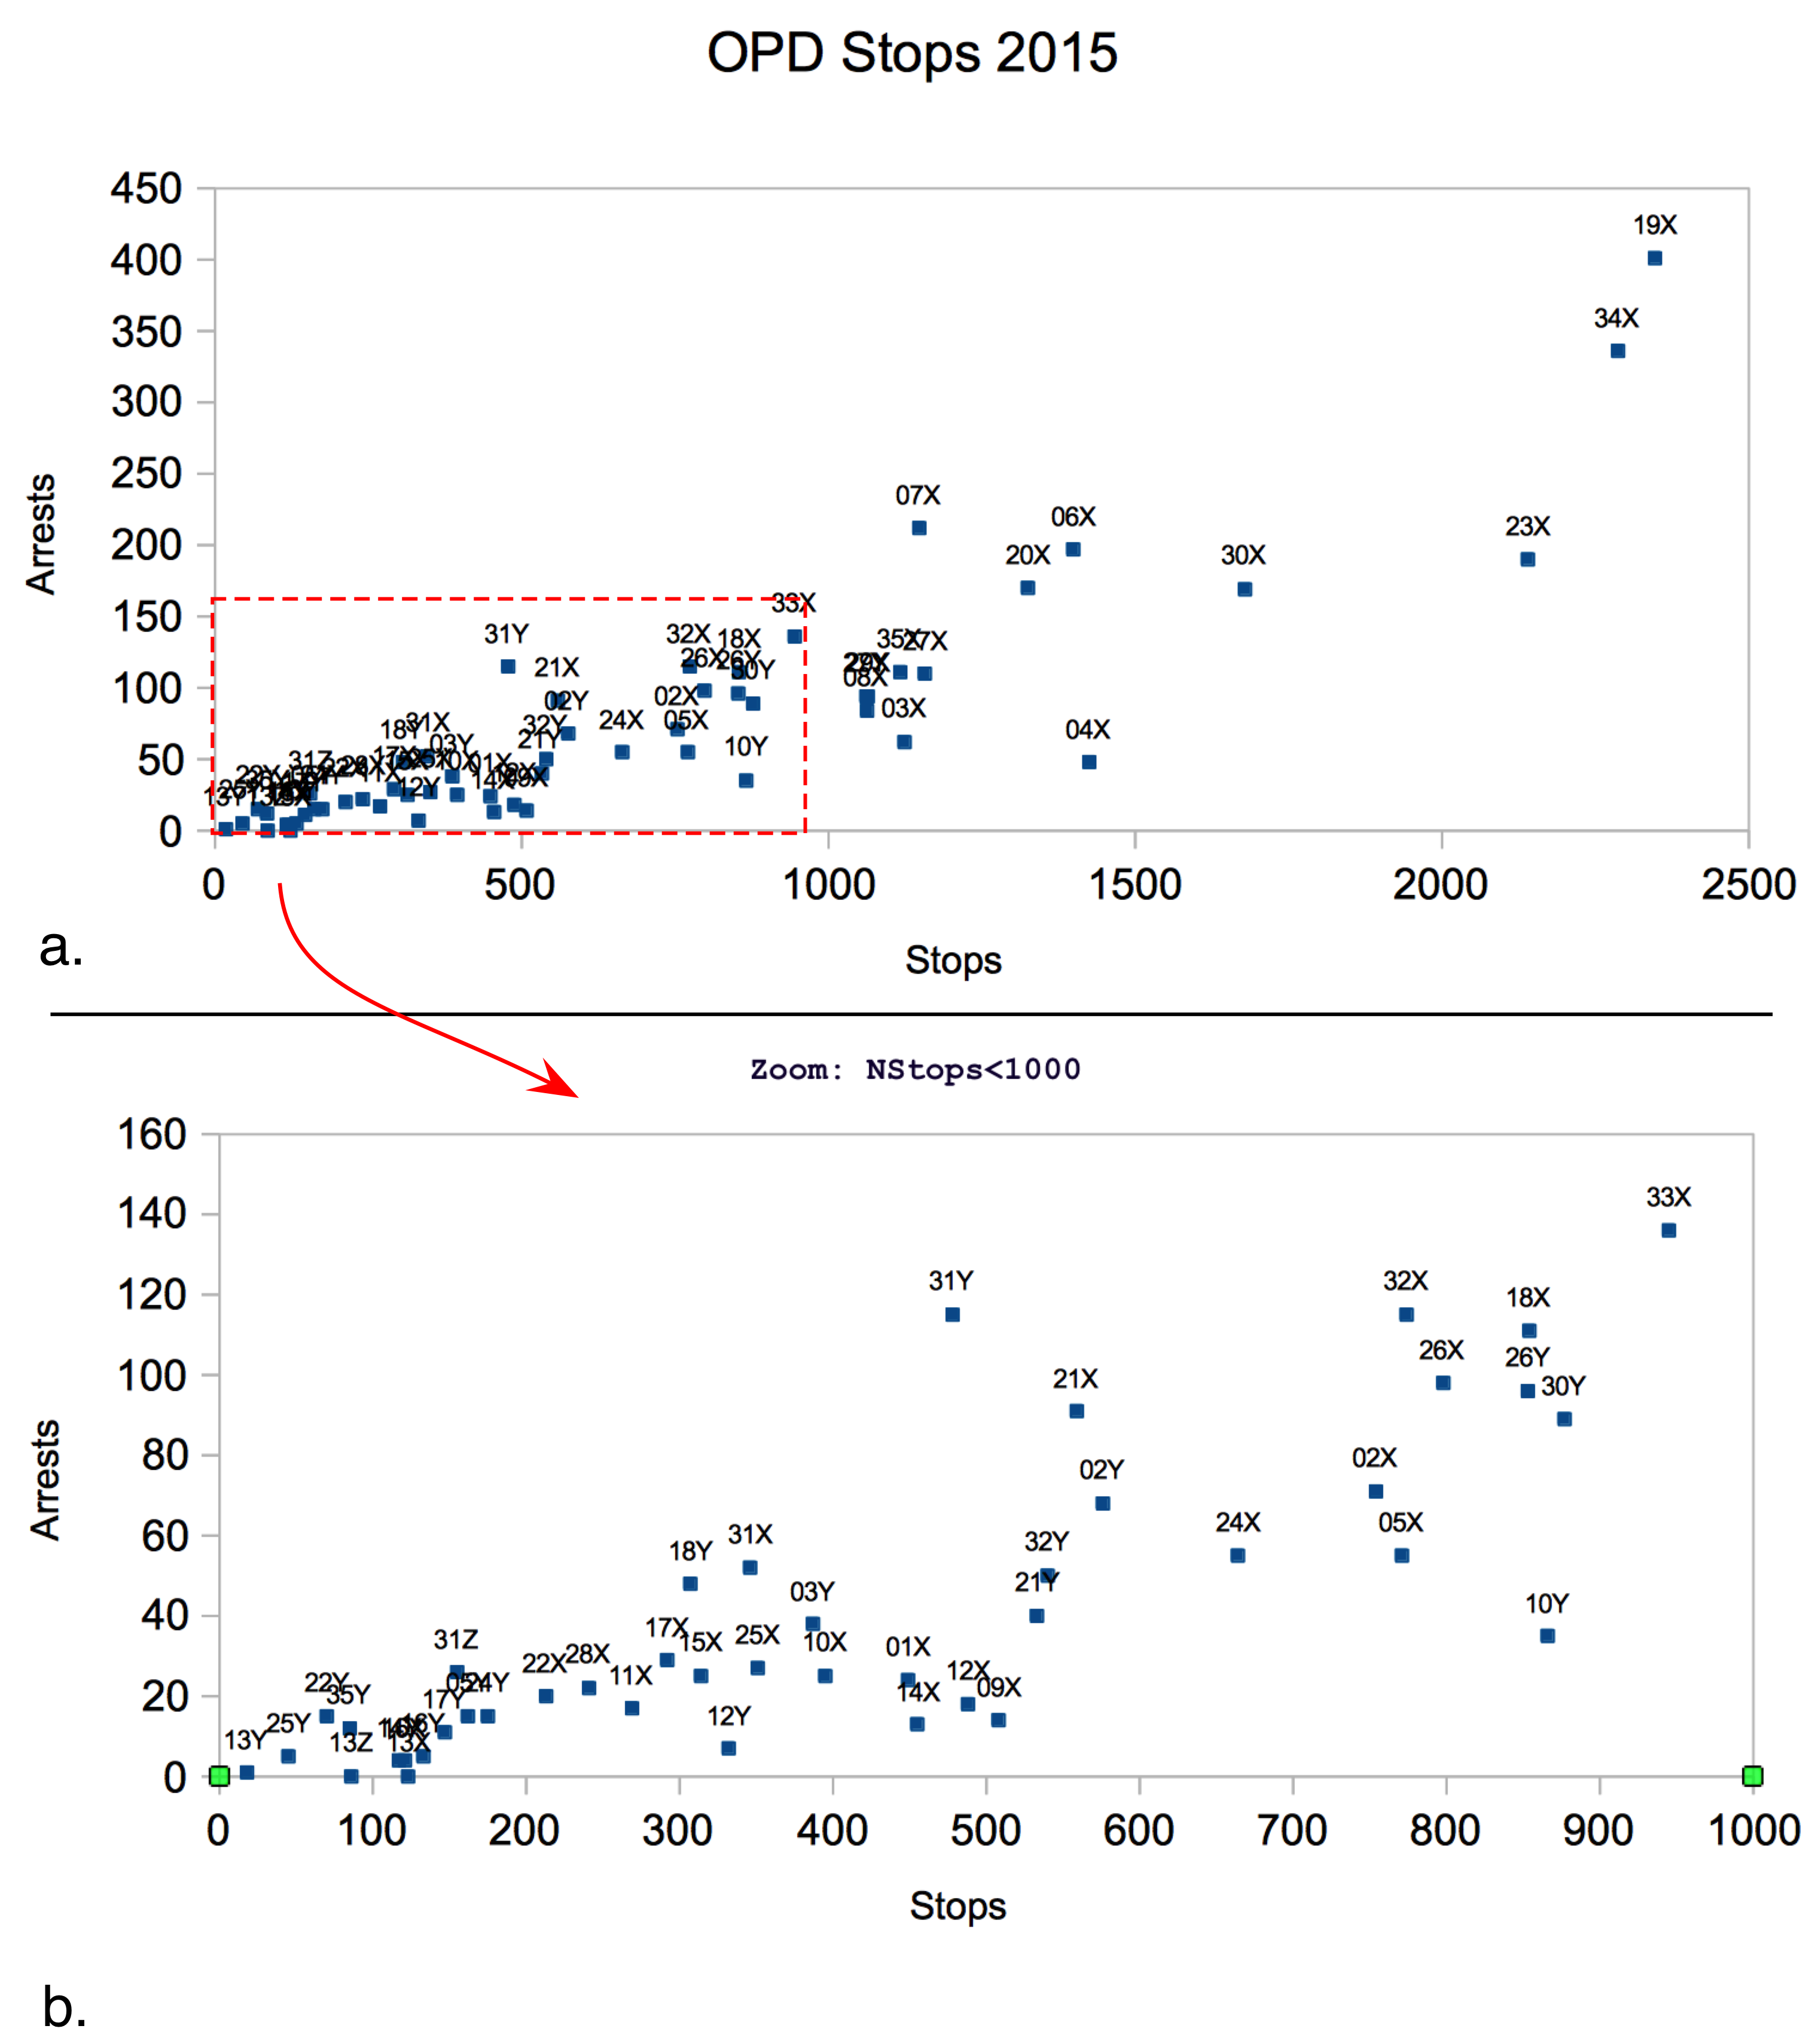
Figure 7
Future work
The OPD stop data also provides details on:
-
the date of the stop;
-
searches associated with stops (whether a search was performed, results of searches), and
-
the sex of the person stopped.
None of these data features are included in the current analysis.
When and if the data underlying Eberhardt and Hetey’s report becomes available, additional comparisons between their data from 2013-14 and the 2015 and subsequent data may be possible.
Supporting data and code
-
OPD’s stop data for 2015
-
Analysis code (Python)
-
Visualization code (Javascript, d3)