
I’ve been working with OPD’s crime data since the fall of 2012. Through the generous efforts of Ahsan Baig, Andrew Wang, Kiona Suttle and others within Oakland IT and OPD Records, I was provided with retrospective crime data going back to 2007. This was designed to augment the 90-day window of crime data OPD has provided via FTP access for some time. I have also augmented this data stream with other crime data (provided by OPD to Urban Strategies Council, and via public records request), and regularly publish the result via data.openoakland.org .
One significant aspect of this data is that while the basic record has a unique identifier – the crime ID (CID, aka “case number” or “record ID”) – it often happens that multiple records share the same CID. This is because the basic unit of reporting is the charged crime incident, of which there may be more than one with the same CID. As a concrete example, CID 12-04229 is associated with two different incident charges:
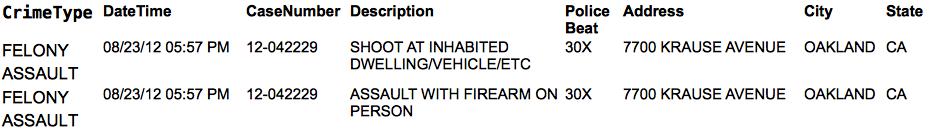
While both crime incidents share the same date-time, address, beat and crime type, two separate crime descriptions are reported.
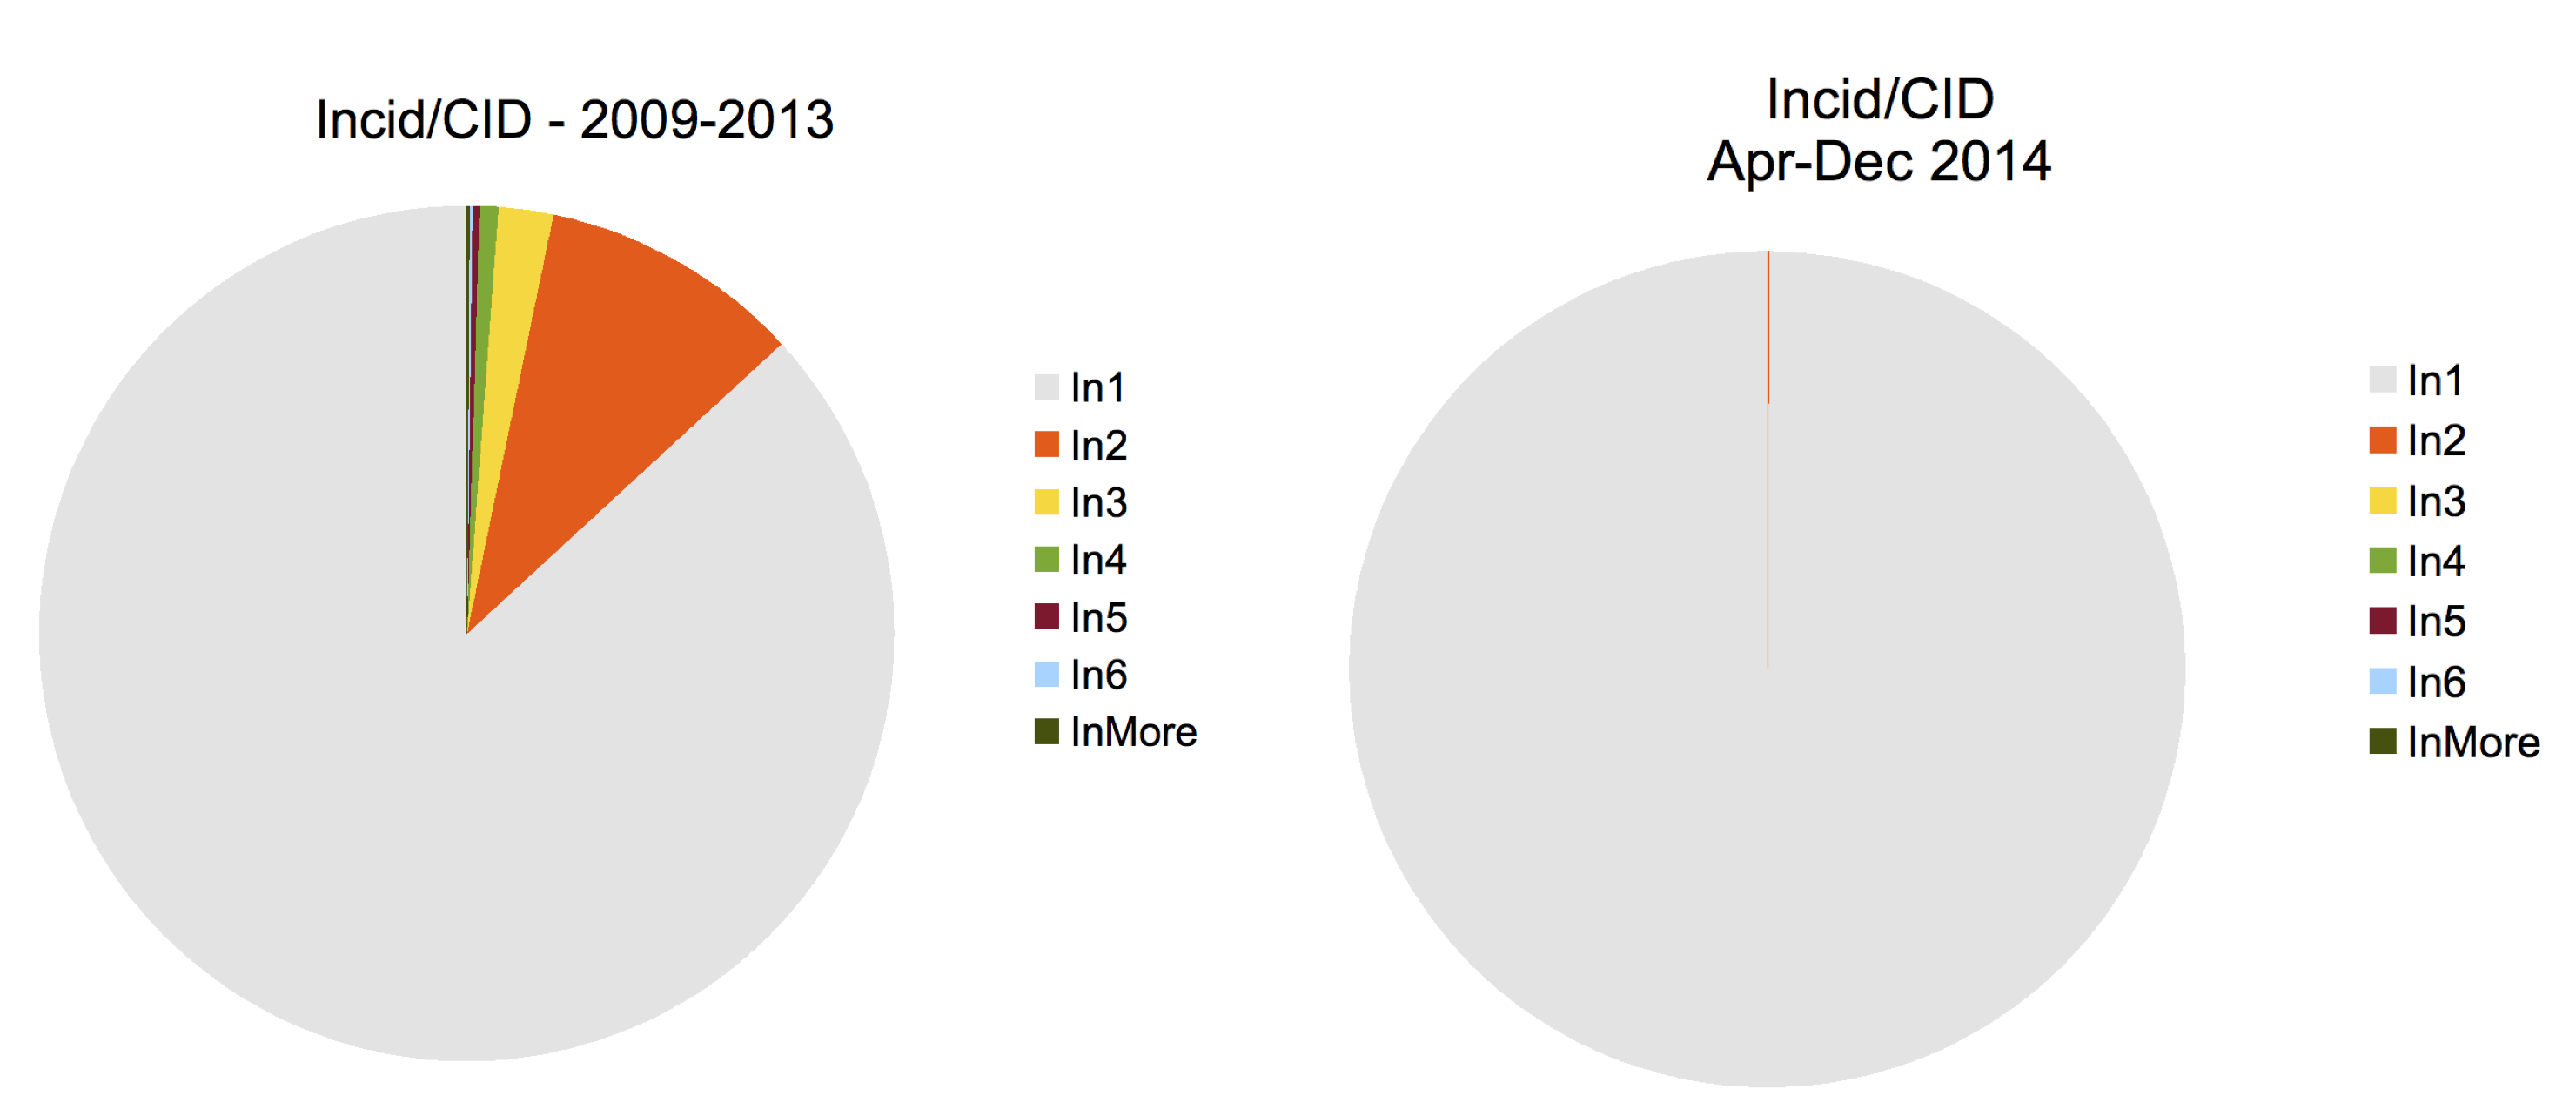
As I’ve been merging 2014 data into prior years’, I have noticed a significant difference from previous reporting patterns: In years 2009-2013, the average number of incidents per CID has hovered near 1.2. That is, while most crimes generate a single CID, 13% of the most serious ones involve multiple crime incidents per CID.
The first pie-chart below shows how the additional 1.2 incidents per CID are distributed, as an average over the years 2009-2013 during which it remained quite stable. Most CIDs are associated with one incident (labeled In1), about 10% of CID are associated with 2 incidents (In2), 2% with 3 incidents per CID, etc. As shown in the second pie-chart, however, after March 2014, the number of crimes per CID went to 1.0004; there were only 12 CIDs with more than one incident across all 8 months since April’2014. In contrast, there were 5473 CIDs associated with multiple incidients in 2013.
The graph below views number of CID, number of incidents (left scale), and the ratio of these two numbers (right scale) as they vary across the months of 2009-2014.
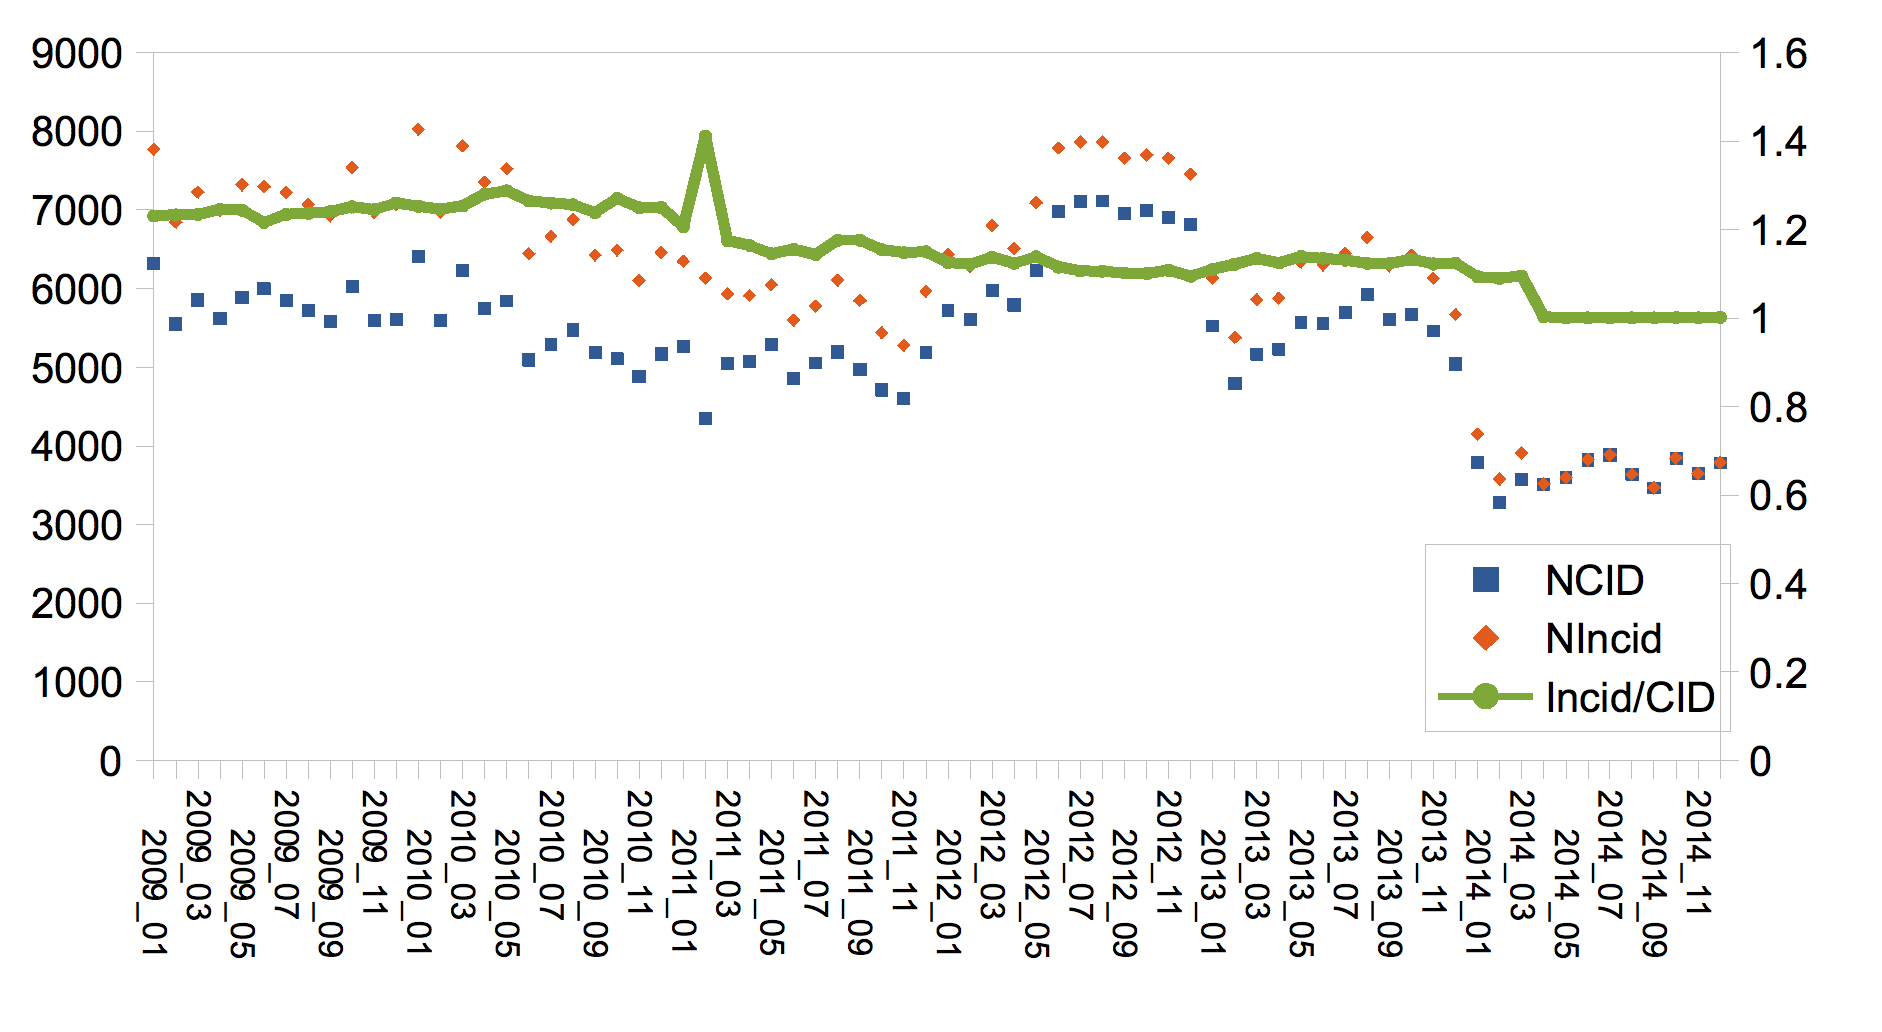 First, the marked drop in crimes-per-incident in April, 2014 is clear. Second, note by contrast how stable the ratio remains over the years, even across the significant increased crime experienced during 2012; while there were many more CID and incidents during 2012, their ratio was consistent with other years, except for 2014.
In addition to this change in incident-per-CID reporting, the graph also demonstrates a drop in all crime reporting for 2014: the number of CID/month drops from 5470 in 2013 to 3651 in 2014. This 50% drop in crime reporting does not seem consistent with OPD’s own summaries for 2014 as part of federal Unified Crime Reporting (UCR).
Why it matters
It appears that OPD, and/or Oakland’s IT department which provides its data to the public, made some change in its reporting practices around April 1, 2014. Since that time, Oakland citizens have had a much reduced picture of crime in our city, particularly those most serious incidents involving multiple charges.
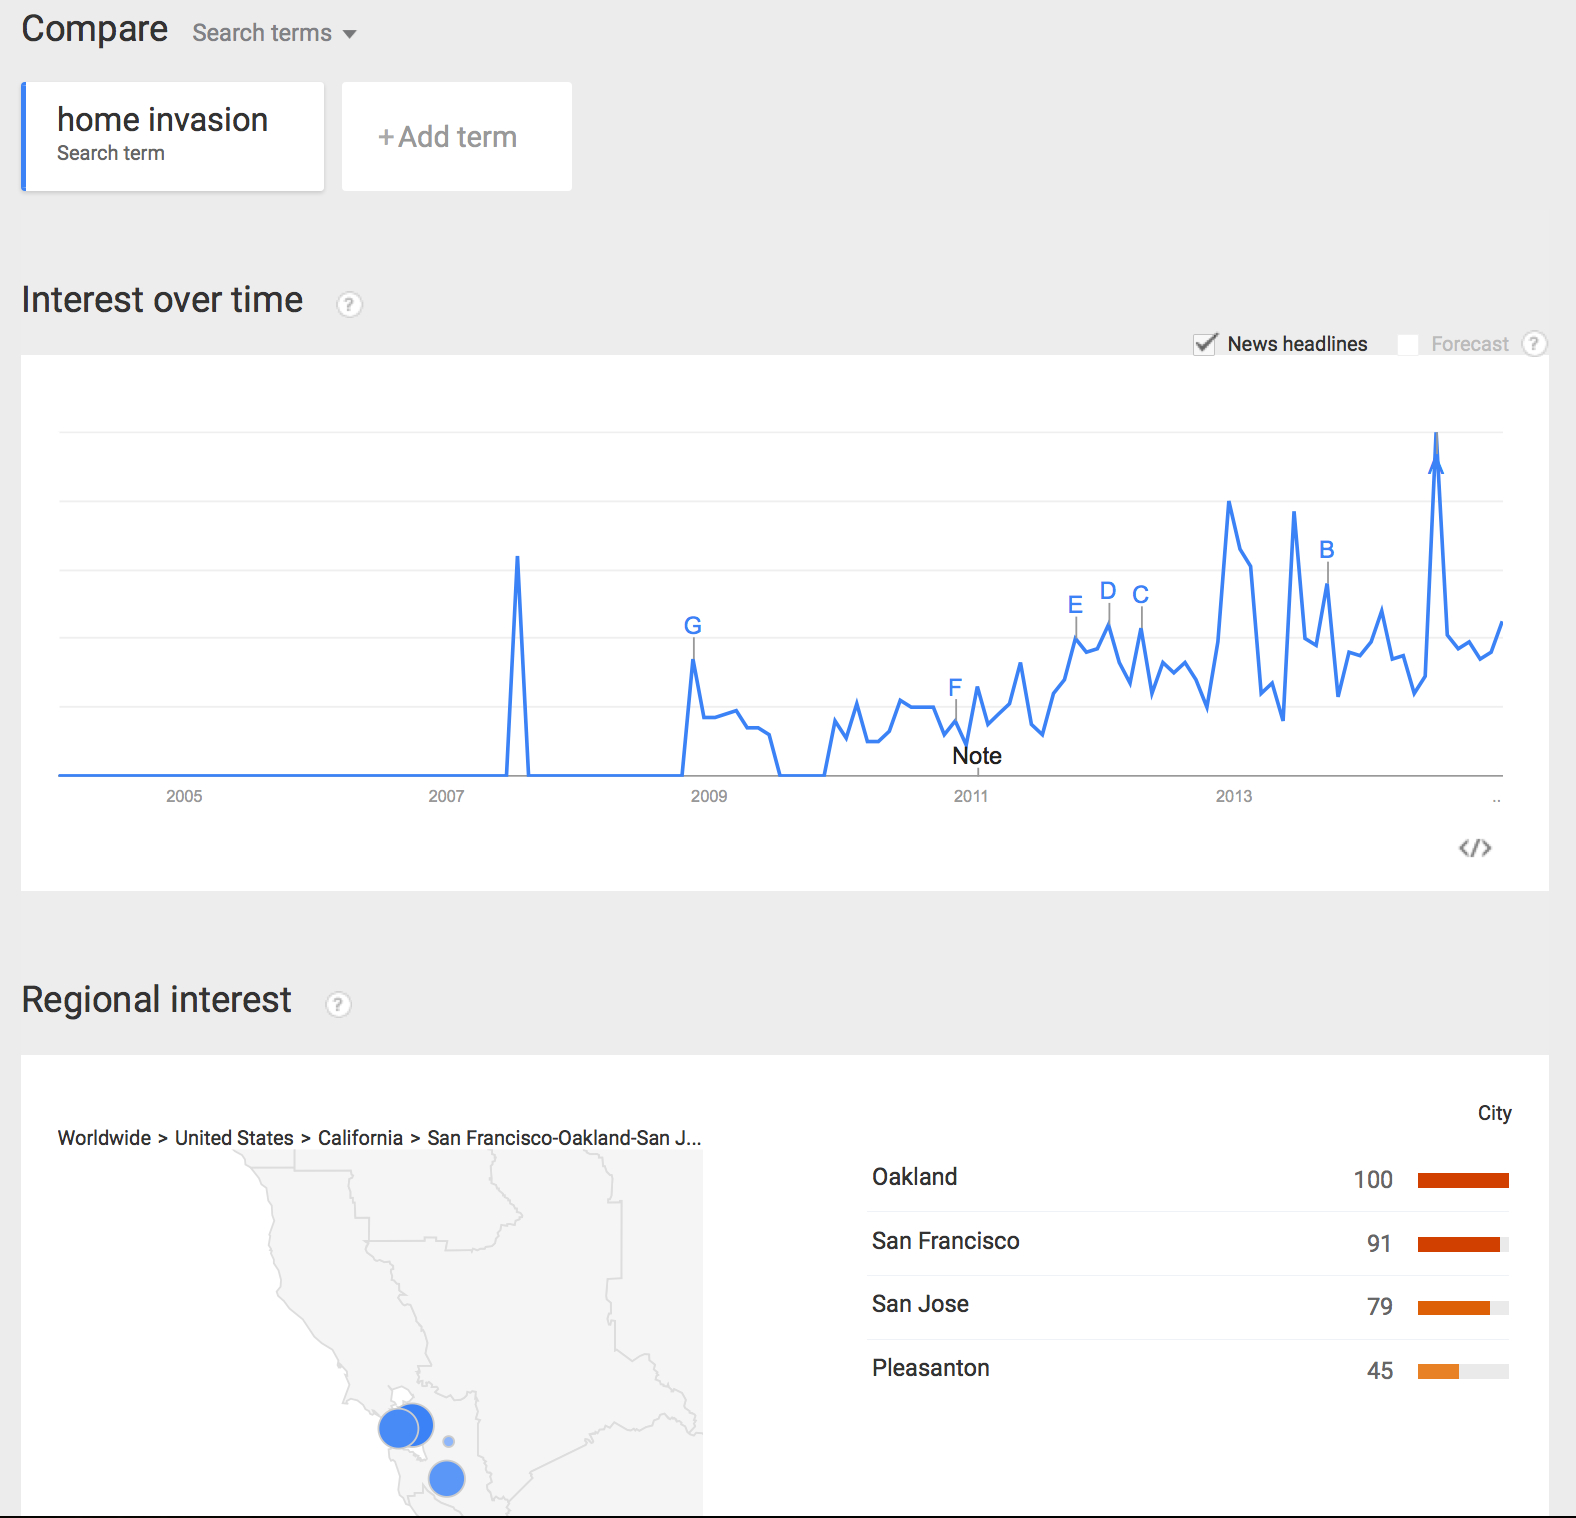
While the gross, top-level statistics of crime caterogies required by UCR/FBI reporting provide important national comparisons, many important features of Oakland’s crime situation lie at a level below the top-level crimes categories. For example, “home invasions” have become a recent topic of interest in Oakland, as demonstrated by the GoogleTrends data below.
 Henry Lee recently reported in SFGate [SFGate Henry Lee, 4 Jan 15] on a “spike” in “home invasions” crimes, relative to previous years. He cites evidence, provided by OPD, that there were 191 of them in 2014. It is important for Oakland citizens to be able to identify these events within the data OPD provides to them. For example, do they correspond to the example CID=12-04229 used above and share the pattern of descriptions SHOOT AT INHABITED DWELLING and ASSAULT WITH FIREARM ON PERSON, or to some other pattern?
More generally both OPD and Oakland’s citizens share the need for an official reporting of crime in our city that all can trust as complete, accurate, and consistent with reporting provided to other agencies.
Specific Questions
-
What accounts for the large reduction in the number of incidents per CID reported since April, 2014?
-
What accounts for the large reduction in total CID reporting volume since April, 2014?
-
What are the specific CID’s and all incident reports supporting the statistics provided to Henry Lee.
- For this data, what is the statute number associated with each incident, and the UCR number associated with each CID.