
It’s my pleasure to announce the availability of ShowCrime, a visualization tool for Oakland’s criminal past. (Presently access requires a password; let me know if you don’t have one and want to try it out.)
As loyal readers will recall, I have been working on historical data provided by the Oakland Police Department (OPD) as part of OpenOakland, a CodeForAmerica brigade. Earlier
stages have cleaned up this data, and merged it with will contain data analysis done by Urban Strategies Council (USC) In 2012; details of this merge described below.
ShowCrime is designed to provide a baseline of retrospective statistics and analysis, allowing comparisons with new proposals for open data standards now being developed.
Let’s begin with the main plot you can get:
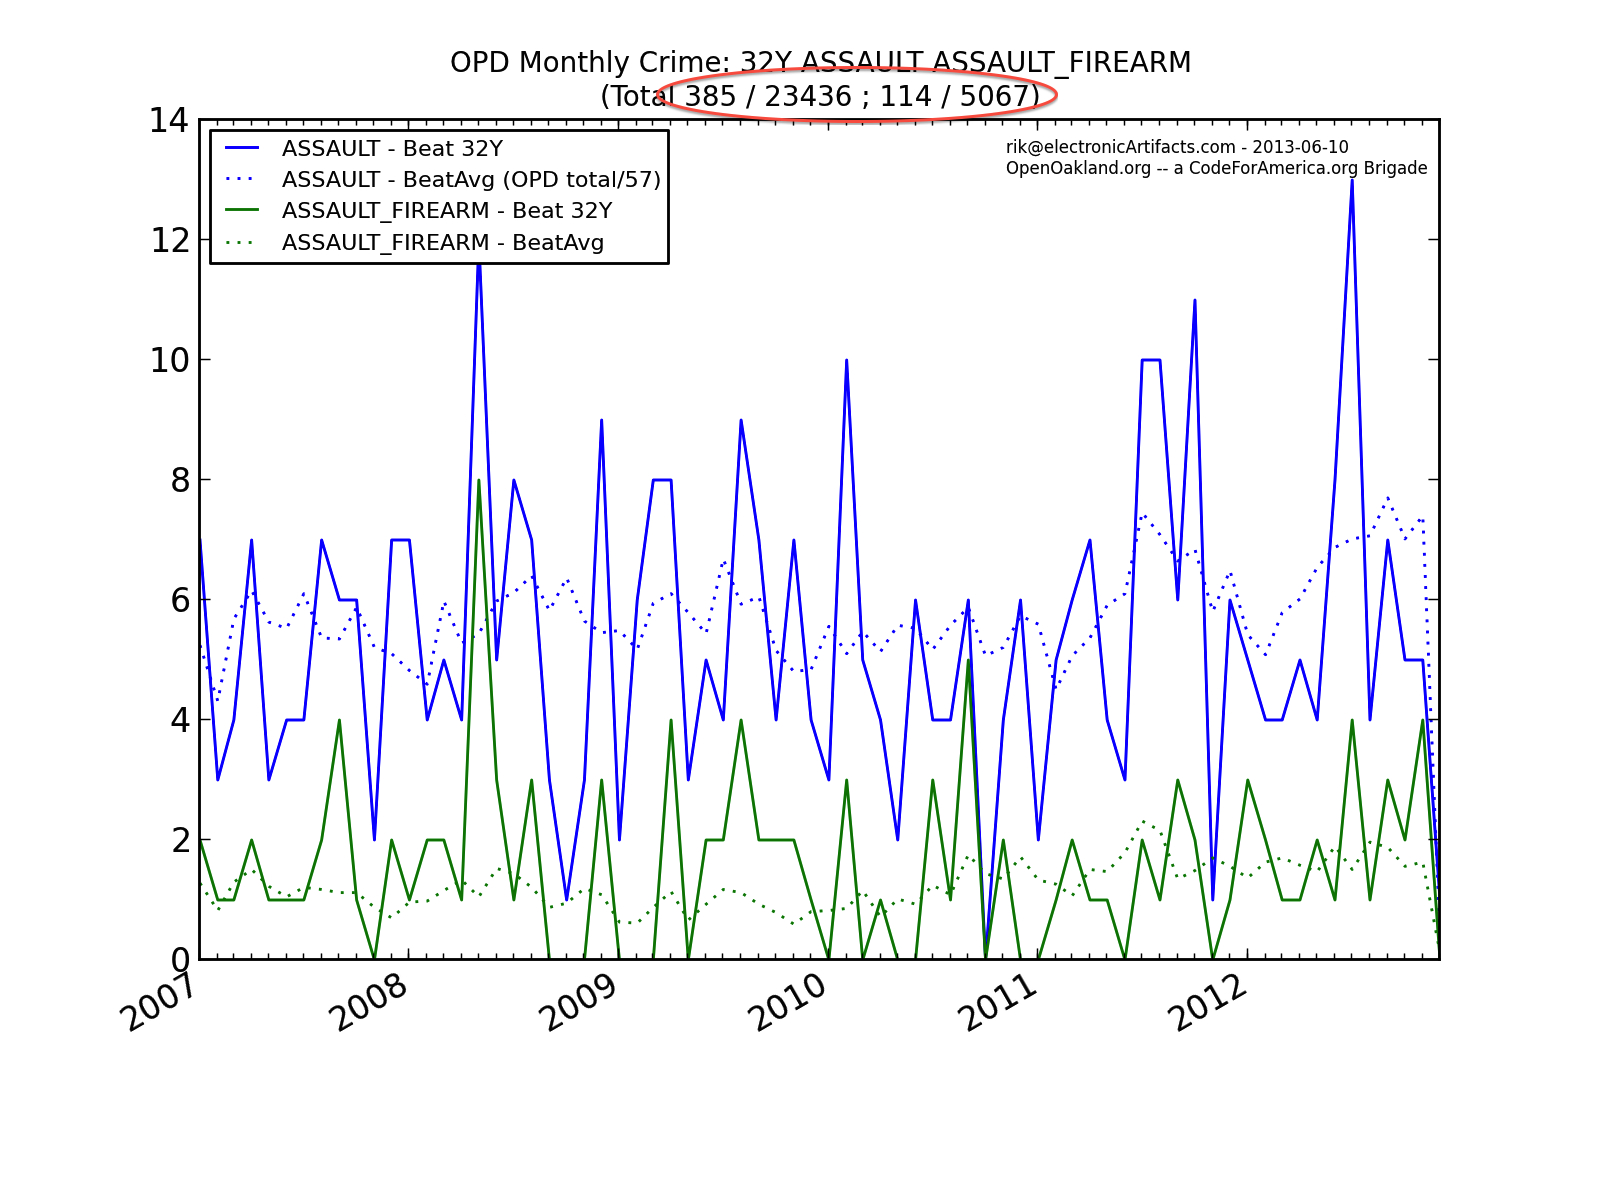
This shows shows four curves over the years 2007 through 2012, selecting for a particular beat, and two different crime types. Beat is a geographic region defined by OPD, and an attribute associated with each crime occurrence, in this plot beat 32Y is being analyzed. CrimeCatOAK refers to a hierarchy of crime types described elsewhere. This hierarchy is also the result of a merge from many sources; details of the classification process are also described below.
Two blue curves shows the total number of ASSAULT crimes, aggregated by month, for the selected beat. The solid line shows the statistics for just beat 32Y. The city-wide “average beat” curve is a blue dotted line; this is just the city total, divided by 57 (the number of beats). Early user testing suggests many Oakland residents are interested in how their own beat’s statistics compare to city averages, and scaling by the number of beats provides a reasonable baseline. The two green curves are similar, showing statistics for ASSAULT_FIREARM crimes, for just beat 32Y (green solid) and the city-wide average (green dotted).
A couple of fine points:
- The plot’s title mentions both the beat and crime type, followed by four numbers in parentheses (circled in red). These are the total number of the crime type over the 2007-2012 period, within the beat and city-wide, for each of the two crime types specified in the query.
- Also note that some plots have a fractional number of crimes labeling the vertical (Y) axis. That’s because there are averages being taken on a monthly basis, and infrequent (but often very serious) crime types may well happen at low enough rates that fractional values are appropriate.
Data model
A key assumption made in this project is that city’s official OPD police distribution is and must remain the primary provider of record, of base crime data for the City of Oakland. The range of third-party vendors building from this source continues to grow, and we are optimistic that some of these will also make their data publicly available.
For example, USC has done great work in the past analyzing OPD data. This project has made use of that work, and some results would not be possible without USC input. In particular USC provided geo-coding of crime locations, both before the termination of their OPD contract, as part of a follow-up analysis in April, 2013, and by virtue of “extrapolation” techniques (when the same street address was mentioned more than once).
The figure below shows the primary OakCrime data type defined by this project, and its relation to data provided by OPD and USC.

OPDCrime data type and its relation to OPD, USC and CrimeCatOAK data
The blue lines capture the dominant role played by OPD’s data. Green lines show USC’s data contributions: latitude/longitude data, and also some UCR and statute labeling for some OPD data. These USC attributes have been brought forward into the merged data set, but were not used for CrimeCatOAK classification
Crime categorization
Before describing the CrimeCatOAK system, it is important to acknowledge that it is far from perfect. A perfect “crime categorization system” would be provided and endorsed by OPD, relating their itemized crime reporting to the aggregate statistics they provide elsewhere on their website, to the FBI, via the California Attorney General. But because no such classification system has been provided by Oakland, CrimeCatOAK has been developed. CrimeCatOAK refers to a hierarchy of crime types described elsewhere.
An assignment of crimes to these categories was built from OPD ctype and desc attributes. An analysis of the distribution of these two attributes taken independently, as well as interactions between the variables between these two fields, was performed. The result is a process beginning from a data table capturing dominance by a crime type only (n=11), dominance by description only (n=145) or interactions between these two attributes (n=186). The data table (crimeCatMap_130506.csv) driving this classification process is available to anyone interested.
94% of all OPD records can unambiguously be assigned to a unique CrimeCatOAKe in this matter. A small number (~ 0.5%) of crime items’ ctype+desc combinations result in two different assignments; the most frequent of these are listed in the following table.
|
CType |
Desc |
Freq |
Found |
|
HOMICIDE |
MENTAL ILLNESS |
626 |
[‘HOMICIDE’, ‘MENTAL_ILLNESS’] |
|
THREATS |
DISTURB THE PEACE |
432 |
[‘ASSAULT_THREATS’, ‘DISORDERLY-CONDUCT’] |
|
DOMESTIC VIOLENCE |
CONTEMPT OF COURT:DISOBEY COURT ORDER/ETC |
393 |
[‘COURT_CONTEMPT’, ‘DOM-VIOL_COURT-ORDER’] |
|
WEAPONS |
VIOLATION OF PROBATION-FELONY |
337 |
[‘WEAPONS’, ‘COURT_PROBATION’] |
|
DOMESTIC VIOLENCE |
VIOLATION OF PROBATION-FELONY |
297 |
[‘COURT_PROBATION’, ‘DOM-VIOL_COURT-ORDER’] |
|
VANDALISM |
DOMESTIC DISPUTE |
284 |
[‘VANDALISM’, ‘DOM-VIOL_DOMESTIC-DISPUTE’] |
|
DOMESTIC VIOLENCE |
VIOLATION OF PROBATION-MISD |
146 |
[‘COURT_PROBATION’, ‘DOM-VIOL_COURT-ORDER’] |
|
PROSTITUTION |
VIOLATION OF PROBATION-MISD |
124 |
[‘PROSTITUTION’, ‘COURT_PROBATION’] |
Comps
One way to look at what CrimeCatOAK provides is compare it to an alternate. CrimeMapping.com is paid by the City of Oakland (?? how much ??) (approx $1200/year for CrimeMapping, but only if Omega installs its full CrimeView stack for ~$80-100k/year; see comment below) to provide a similar analysis. An experiment was performed taking data provided by OPD for the dates 18 – 30 April, 2013. OPD listed 1167 incidents during this period. CrimeMapping reports a total of 496 during this same period, i.e., only 43% of what OPD provides! A summary of the crimes most frequently missed by CrimeMapper’s analysis is shown in the table below.
|
Ctype |
Desc |
Freq |
|
STOLEN VEHICLE |
VEHICLE THEFT – AUTO |
78 |
|
BURG – AUTO |
BURGLARY-AUTO |
53 |
|
BURG – RESIDENTIAL |
BURGLARY-FORCIBLE ENTRY |
50 |
|
PETTY THEFT |
THEFT |
38 |
|
MISDEMEANOR ASSAULT |
BATTERY |
36 |
|
VANDALISM |
VANDALISM |
34 |
|
DOMESTIC VIOLENCE |
BATTERY:SPOUSE/EX SPOUSE/DATE/ETC |
32 |
|
VEHICLE THEFT – AUTO |
31 |
|
|
ROBBERY |
ROBBERY-FIREARM |
22 |
But there’s more: CrimeCatOAK also provides a more refined analysis than CrimeMapping as well. The table below shows how CrimeMapping’s nine “gross” categories are broken up into the more refined crime categories within CrimeCatOAK.
|
CrimeMapper category |
Freq |
CrimeCatOAK |
CCOFreq |
|
theft-larceny |
153 |
LARCENY_BURGLARY_AUTO |
84 |
|
LARCENY_THEFT_PETTY |
36 |
||
|
LARCENY_THEFT_GRAND |
19 |
||
|
<unclass> |
14 |
||
|
assault |
93 |
DOM-VIOL_BATTERY-SPOUSE |
32 |
|
ASSAULT_OTHER-SIMPLE_MISDEMEANOR |
25 |
||
|
ASSAULT_THREATS |
12 |
||
|
<unclass> |
11 |
||
|
ASSAULT_OTHER-WEAPON_FELONY |
3 |
||
|
ASSAULT_OTHER-WEAPON_MISDEMEANOR |
3 |
||
|
ASSAULT_FIREARM_FELONY |
2 |
||
|
VANDALISM |
2 |
||
|
WEAPONS |
1 |
||
|
ASSAULT_FIREARM_MISDEMEANOR |
1 |
||
|
LARCENY_THEFT_VEHICLE_AUTOS |
1 |
||
|
motor-vehicle-theft |
84 |
LARCENY_THEFT_VEHICLE_AUTOS |
84 |
|
robbery |
44 |
ROBBERY_FIREARM |
22 |
|
ROBBERY_STRONG-ARM |
17 |
||
|
<unclass> |
2 |
||
|
ROBBERY_OTHER-WEAPON |
1 |
||
|
ROBBERY_KNIFE |
1 |
||
|
ROBBERY_INHABITED-DWELLING |
1 |
||
|
burglary |
44 |
LARCENY_BURGLARY_RESIDENTIAL |
33 |
|
<unclass> |
5 |
||
|
LARCENY_BURGLARY_COMMERCIAL |
3 |
||
|
LARCENY_BURGLARY_OTHER |
2 |
||
|
LARCENY_BURGLARY_AUTO |
1 |
||
|
vandalism |
32 |
VANDALISM |
31 |
|
<unclass> |
1 |
||
|
drugs-alcohol-violations |
23 |
DRUG_POSSESSION_NARCOTICS |
10 |
|
DRUG_POSSESSION_OTHER |
9 |
||
|
<unclass> |
2 |
||
|
DISORDERLY-CONDUCT |
1 |
||
|
DRUG_POSSESSION_MARIJUANA |
1 |
||
|
disturbing-the-peace |
22 |
DISORDERLY-CONDUCT |
18 |
|
<unclass> |
3 |
||
|
DOM-VIOL_PHONE |
1 |
||
|
homicide |
1 |
HOMICIDE |
1 |
Summary
ShowCrime has been designed as a place-holder: an example of what is possible using even old, dirty data. As I’ve said before, Oakland and OPD are getting ready to change their internal data collection procedures, and their policies for providing data to the public through data.oaklandnet.com; it also seems they are going to spend some real cash doing so. Certainly a much better version of ShowCrime should be possible, especially if the city winds up paying vendors to help.
In the interim, ShowCrime could use lots of help. Here are some of the first:
viewing two CrimeCatOAK categories on the same plot(done!)- (client-side JS, jquery,…) polish and flash
- geographic smarts far beyond beats. Much of the data is geo-tagged, and all we need is an industrial-grade geo-server as part of OpenOakland.org, or similar.
- With geographic support, much more relevant analyses based on census tracts, existing and proposed OPD districts, etc. can be performed
- The details of the CrimeCatOAK could and should be connected to OPD’s reporting procedures much more directly.
Come help Openoakland.org make it better!
thanks to these pointers from an anonymous reader re: Omega pricing:
* From Omega, 2 years ago:
http://www.theomegagroup.com/police/esri_omega_ela.html
* a quote for Greensboro to implement the CrimeView stack.
http://www.digtriad.com/news/article/276849/57/New-Tool-Mapping-Crime-In-Greensboro
I’ve had communication from Ahsan Baig, head of IT services for OPD. His staff confirms that gaps between OPD reporting and CrimeMapping.com presentation of the data are real. Omega — the company behind CrimeMapping.com — receives a special data stream directly from OPD’s RMS (OPD’s internal data system) , and does not rely on the public data feed. OPD and Omega are still figuring out where their communication is buggy. When they report back, I can repeat my analysis.