Every election cycle the amount of money spent trying to sway results increases. Because of the Citizens United decision but other factors, too, the volumes of money involved makes news daily. You read all the time about just how much money is sloshing through the system, the big donors providing it, the tricky ways it ultimately filters through to candidates via various PACs and other committees. But I don’t want to just know about the activities of the Koch Brothers, Adelson or Karl Rove in isolation, I want to try to understand the flow of vast dollars through the system of political finance; I want to build a graph (in the mathematical sense) for this data. Excited by the data provided as part of the “Follow the money” contest sponsored by Center for Investigative Reporting (CIR) and Investigative Reporters and Editors, Inc. http://www.kaggle.com/c/cir-prospect , this seemed possible.
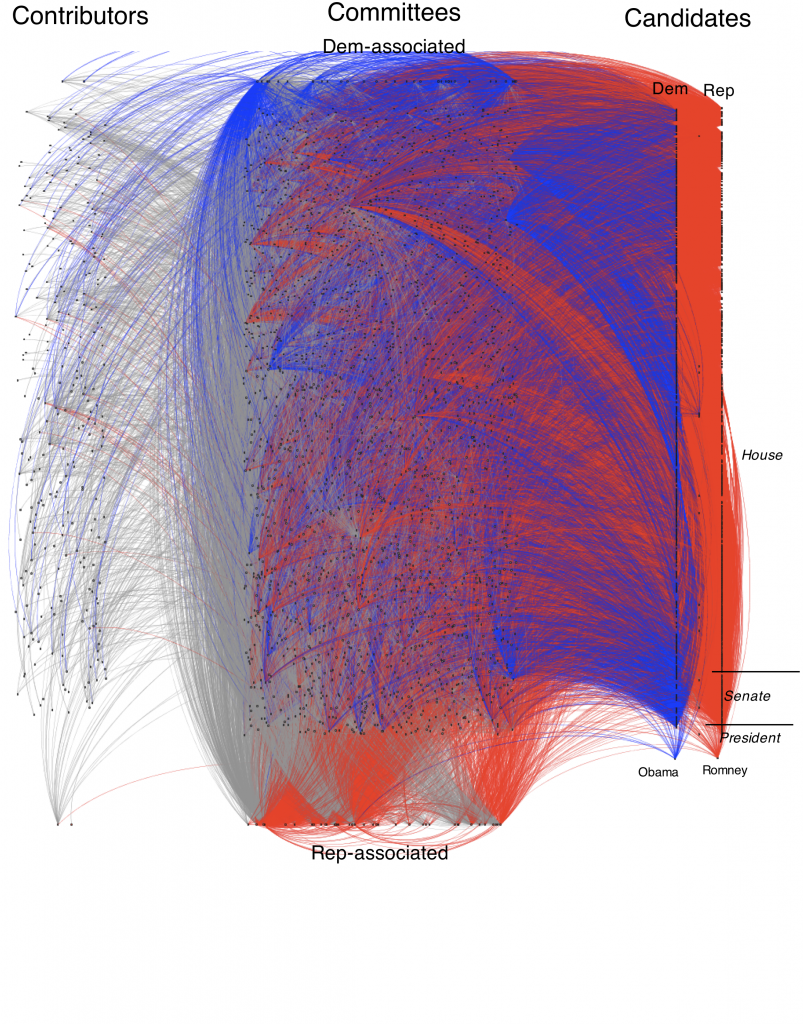
I’ve completed a gross, first-pass analysis, and one result is captured by this figure:
 This is a 7Meg PNG image; a 400K JPG is also available here:
This shows contributors on the left, providing funds to a large set of committees in the middle, which provide funds to candidates on the right. Blue/red colors have been used to flag Democratic/Republican party affiliations of candidates and some committees.
A second analysis focuses on “competitive races”, the set of candidates competing for the same office.
There are of course many important details as to how these graphs were constructed. I’ve provided a brief description in this CIR tech report (updated 12 Nov, PDF, 12Meg). Behind this there is ~1000 lines of Python code digesting the original mysql database provided by CIR via Kaggle.
This (12 Nov 12) update is now post-election. While my work certainly informed my understanding of the 2012 election, I am sorry to say that none of it is conclusive. My goal now is to do better for 2014. If you find any of this useful in the iterim, please let me know!
- http://influenceexplorer.com/
- I only ran across http://influenceexplorer.com/about/methodology/campaign_finance via a google search: “fec 24k pac”!?
- http://services.sunlightlabs.com/docs/Sunlight_Congress_API/
- http://www.followthemoney.org/index.phtml
- http://prototype.nytimes.com/gst/apitool/index.html
- http://www.programmableweb.com/apis/directory/1?apicat=Government
Boy, do I wish the CIR organizers at Kaggle had alerted us to these!

Glad to see I’m not the only who’s working on this! If you treat the candidates as “Receivers” and everyone else was “Sender”, and play around a little with Forces Atlas 2, you get a very different graph that’s slightly clearer. It even shows the “Support” and “Oppose” in the middle of the graph. I’m not sure how to paste it on here, or I would.
But some questions that I would love to explore with others is how the donors/senders are linked, and how these are linked to the other senate races around the country.
hi, and glad to hear others are bringing Gephi to bear on this.
and i’m afraid that you’re right: wordpress (at least this simple theme) does not seem to allow comment posters the ability to attach any media. you should be able to put in a link to any images you have posted elsewhere, tho.
Just checking in. Did you get anything done with this?
I’m going to use your code for a slightly different thang. I wrote some automated toolz to download Austin PD’s “incident database” (everyone they arrest in the past 18 months) and then downloading each arrestee’s criminal history from the municipal court’s site. I’m gonna use your code to chart how different races’ punishments end up.
hi Brandon, yup i used the election energy to push thru another bit of development on this, focusing on particular races; i’ll write that up Real Soon Now.
i’ll be curious to hear how the code i wrote for this transfers to police incident reports?! as it happens, i’m working with an Oakland “brigade” of CodeForAmerica, http://openoakland.org/ and interested in public access to police department data. small world…
I’m using your code (or maybe now ForceAtlas 2 … ) to map the outcomes of criminal cases based on race for each arrestee (x amt of jail, fines, nothing, probation, community service, a warning, etc). I live in TX, so you can guess how that’ll probably end up (30% of the drug arrests were black while our local population is only <8%).
and dang … if I lived in the bay area (SOMEDAY … when I’m not broke as fuck) I’d totally be down to join into your Code America team … there isn’t one down here.
Brandon (more friendly than junk99 :), i grabbed your code and 2008 election data; thanks.
I also just started a separate page on “against” contributions:
http://rikiwiki.electronicartifacts.com/2012-election-financing/against-contributions
as these are clearly a critical thing to get right. i’m still working on my wordpress licks, so let me know if this sub-page organization works for you.
OK, I uploaded the software. I uploaded the FEC 2008 data in SQL form, too. I see yours works with CSV files … the tools I wrote worked on those files in a DB. My code centers around turning the FEC data into a WEKA ARFF format (which is what I was using to build decision trees), but it can also just print it out to stdout.
https://github.com/brandonrobertz/FECAnalysisTools
one clarification: i am working directly from the mysql dumps, via the _mysql module, not CSV files.
junk99 et al, i’ve posted the code i used on github, as:
https://github.com/rbelew/PyFEC
i gather you’re doing your work mostly via SQL queries? can you post these somewhere, esp. regarding contribution type, indiv employer/occupation analysis?
Yeah, I have all the SQL to pull that data out, as well as the most recent (2008) presidential data to look through. I’ll get it all together and post back here asap.
This is pretty cool, but kind of a blur as-is. Have you done graphs of specific races between two candidates? How about with names of contributors and committees attached to data points with a few select candidates?
Something I did in mine was group contributors by occupation and/or employer. I was trying to see what industries support which candidate. I wonder what a chart like yours with that kind of data might look like.
Is your code public? I’d love to experiment with it.
hi junk99, thanks for coming over (from kaggle).
individual race analyses was one of my first thoughts. but i find many more (non-2012) candiates/ state+office+district keys that seem legitimate. did you figure out how to clean that up?
and looking at indiv’s occupation codes and employers seems a great idea; have you done that?
sure, i’m happy to share my code. i’ll set it up (probably github) and post instructions here. glad to hear you have energy for it, too.